You will build
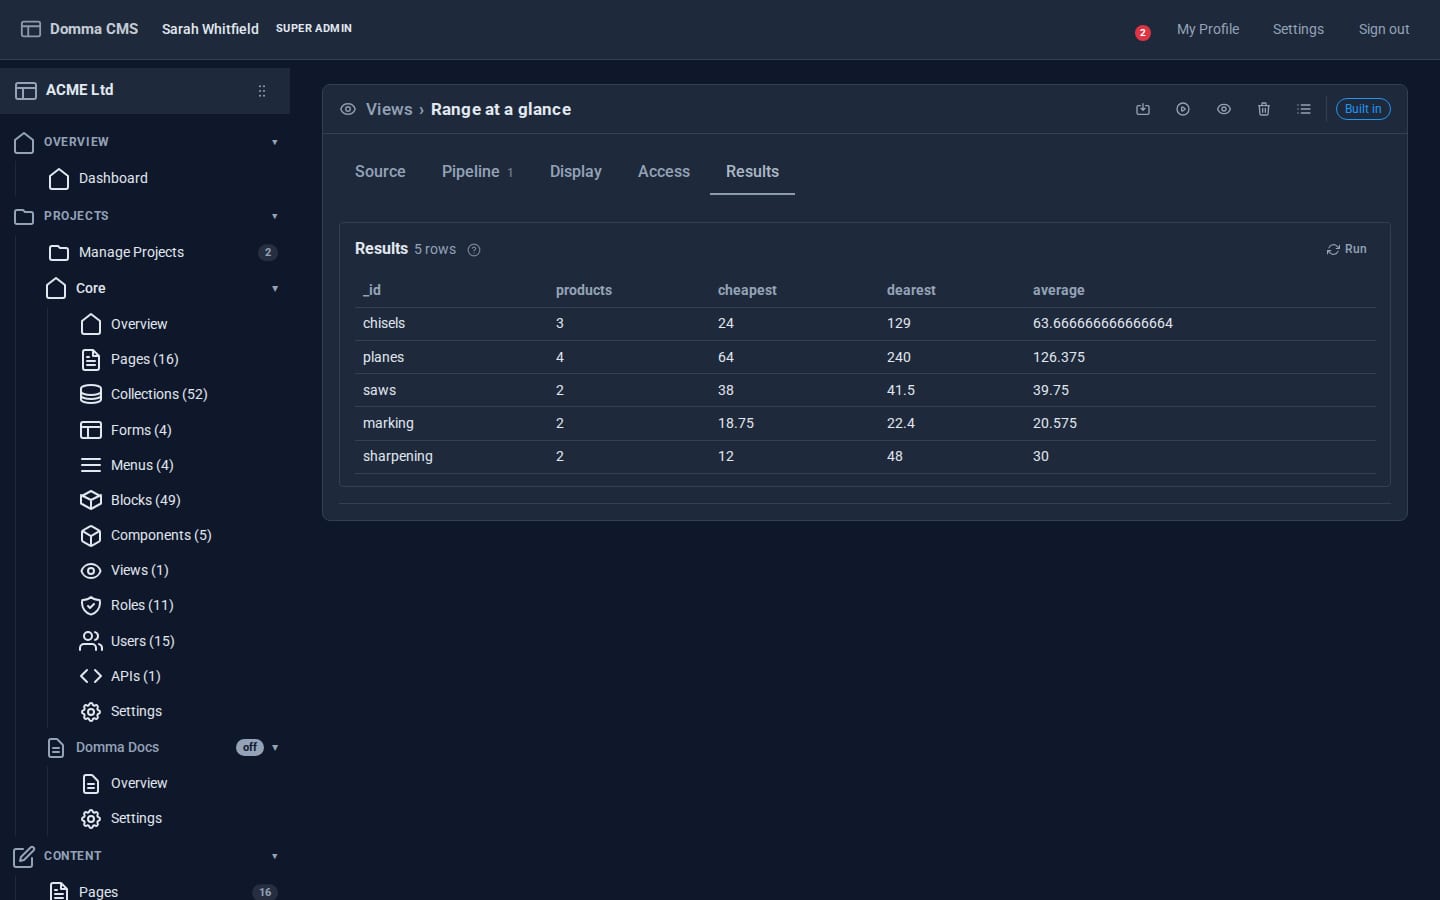
A Range at a glance summary: for each category in ACME's Tool catalogue, how many products, the cheapest, the dearest and the average price - on a page, always up to date.
You need
- A collection with some entries - we use
tool-cataloguefrom Your first collection
What is a view?
A saved question about your data: filter, join, group and total, then show the answer anywhere. Works on file storage and MongoDB alike.
Step 1: Create the view
Go to Data > Views and click the + (New view) button. On the Source tab:
- Title:
Range at a glance(the slugrange-at-a-glanceis made for you) - Source collection:
Tool catalogue
Step 2: Build the pipeline
A view is a pipeline: a list of stages, each working on what the one before it produced. Open the Pipeline tab and use Add stage.
Stage 1 - Group and total. This is where the summary happens. Group by category and work out the figures:
{
  "_id": "$data.category",
  "products": {"$sum": 1},
  "cheapest": {"$min": "$data.price"},
  "dearest": {"$max": "$data.price"},
  "average": {"$avg": "$data.price"}
}
Field paths start with $data. because each entry keeps its fields under data. Totals can use $sum, $avg, $min, $max, $first, $last, $push and $addToSet.
That one stage is the whole summary. As a table on the page, visitors can sort it by any column.
To narrow the figures first, put a Filter rows stage above it - for example category ≠ not equals sharpening. Conditions use equals, not equals, greater and less than, contains and one of, joined with ALL conditions (and) or ANY condition (or).
Other stages you can use: Order rows, Join a collection (bring in fields from another collection), Reshape fields, Compute fields, Flatten an array, Keep the first N, Skip the first N and Count the rows.
Step 3: Check the answer as you go
Open the Results tab at any time: it runs the unsaved pipeline and shows up to 50 rows. To see what a single stage does, right-click it and choose Results up to here. Right-click also moves, duplicates and deletes stages.
Step 4: Choose how it looks and who sees it
On Display, pick the Display mode - Table, List or Block - and the page size.
On Access, tick Public - no sign-in needed for figures anyone may see, or choose the roles allowed to read them. Show each user only their own results limits every reader to the rows they created (or rows whose field matches them), which is how you build "my orders" style pages. Save.
Step 5: Put it on a page
[view slug="range-at-a-glance" /]
[view] accepts every display the [collection] shortcode does - cards, list, accordion, timeline, block and the rest - plus searchable, sortable and paginate for an interactive version. Leave out display and it uses the mode you chose on the Display tab.
Add a product to the catalogue and the figures change by themselves. There is nothing to re-run.
Step 6: Keep an eye on your views
Data > Views lists every view and flags public ones, restricted ones and any whose source collection has gone missing. Right-click one to preview it a page at a time, copy its shortcode, duplicate it or delete it.
What you built
Live figures: filtered, grouped and totalled data from a collection, checked stage by stage as you built it, published on a page with exactly the access you chose.
Keep going
- Ship a public JSON API in five minutes
- One collection, eight looks
- Build a client portal with a confined role
Try it on your own site
Everything in this tutorial is free. One command gets you a site to follow along on.